In the last two months I've now spent quite some time revising and improving visualizations of a larger number of findings when managing many hosts. Aside from result tables that you can ad-hoc properly filter and group by some attribute, host maps group by certain groups are the most useful.
The Polscan Hosts MapHere is a screenshot of the current implementation in Polscan. 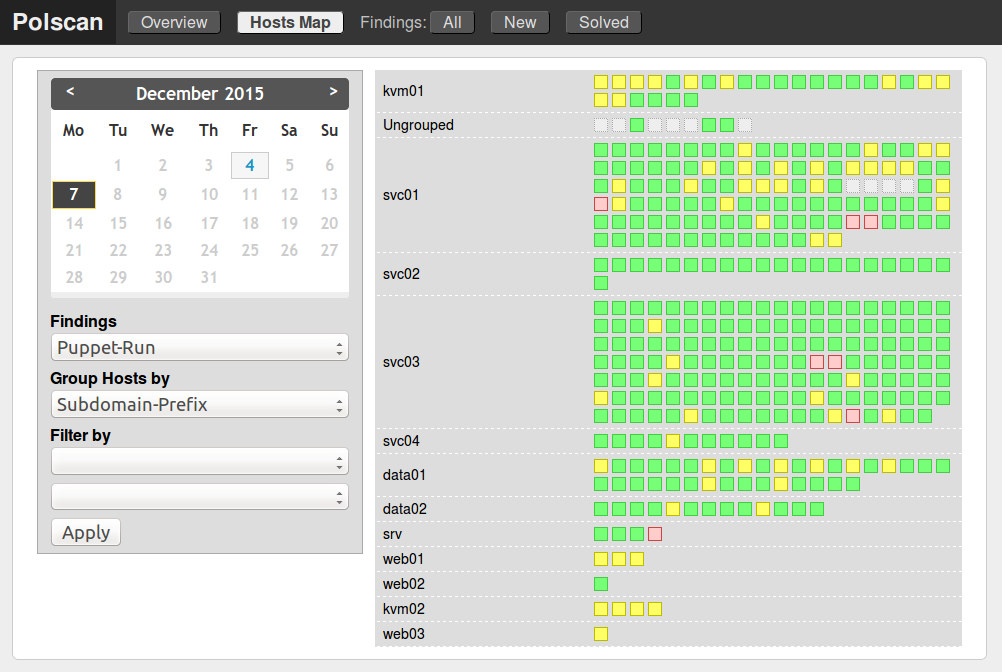 Even without a legend present the traffic light colors give facts away easily. You probably easily spot the six red hosts that have a real problem. Also you see a certain spread of more common yellow warnings in all groups. With some of them being more affected then others. Just visually checking this representation gives you already some insight about ~350 hosts. The same wouldn't work on a result list even if you group it by the same schema.
Good Grouping Possibilities
Having a host map of only ungrouped boxes would not be very helpful. After all we want to correlate findings, their scope and maybe guess at possible causes by group relationships. If we group by let say "Puppet Role" and find all six red boxes in the same group then it is instantly clear that the Puppet code for this role broke. Another time the "Subdomain Prefix" might pinpoint an issue. If only one subdomain is impacted the cause of a finding might be network related or it could be an organizational issue. Maybe the datacenter guys did some dirty stuff on all the hardware hosts. The more groups I can apply against the hosts map for a certain finding type the more structural reasons for a finding I can test. To help with this Polscan has so called host group providers which query host group sources. Current providers:- Domain (listing all domains you have)
- Subdomain-Prefix (extracting all first subdomain parts)
- Mcollective Role (extracting a Puppet role fact you might have via Mcollective)
- autodetect (a provider auto-probing all others)
In the best case you should not need to write own providers. I plan to add Nagios/Icinga providers because IT Ops often keep well defined host groups there. Thinking more on the organizational level: what about providers for- Dev/Ops Team,
- Product,
- Product Component?
If you implement such providers (and I did) you can quickly identify responsibility. You can limit the findings you want to work by filtering on your team and the product you are currently involved with. Additionally your can identify per-product/ per-team backlog, quality and effort based on the frequency and amount of findings.Problems With Group Sources
In Nagios you can easily have multiple host groups per hosts, same in Chef you have run lists with multiple cookbooks and recipes. On a hosts map IMO each host box should exist only in one group. But which one? So for Polscan it is important to only get the "primary" group. Usually there are some conventions that can help identify it. After all these are the groups you probably attach your notifications settings to. So it should be possible to write host group providers.Conclusion
The "Hosts Map" view really helps in daily work. It creates a form of visibility I miss from existing Puppet related tools like Foreman that give me nothing but total numbers. Also it helps to recheck solved issues in just a few clicks without much thinking. Sending links to the host map helps a lot sharing structural findings with fellow sysadmins. As the GUI is static HTML reading static JSON results only I plan to have a demo with a larger result set online soon. So stay tuned...