Possible Scenarios
1. Everything under control
 Scenario: That's the easy one. Your system automation is top notch there are no messy legacy systems, no hacks, no old construction places, no migrations. Everything is polished and when a new issue appears you automate it away, and 10min later it gets silentely applied on all your systems. Presentation of Findings: You are in control, so you have a top level view, birds eye perspective. You spot abberations and tackle them. You can optically find the rogue policies/groups with a red number. And if there are none you work on reducing warnings, because you are bored. You spend most of your time in the summary view waiting for the auditor to present him with full compliance to everything he asks :-)
2. I'm swamped!
 Scenario: You are afraid of adding more policies, as it would look even worse. You feel like you never will be able to get a clean system and at the same time your professional pride tells you have to get it under control! Presentation of Findings: If there is no progress you do not need to try to fix anything. So it's most important to check for progress. What you care most about is the trend curve of all the findings. It gives you hope that one day all systems will be clean. The problem here is that a ternary state OK/WARNING/FAILED does not cover how policies have different priorities. And that 2 findings out of all 500 might be absolutely critical, while 200 others are low impact issues. A trending curve does not show that you have fixed the 2 critical ones, but it nags you about not fixing all those 500 problems.
3. Let's improve something today
 Scenario: It's like scenario #2, but with a positive psychological perspective. You do not care that there are a lot of issues, but you are highly motivated to solve some of them. You browse through the results intending to pick low hanging fruits and will eliminate them with your "Just do it" attitude. Presentation of Findings: Skimming results is important. Statistics also are because you want to work on stuff that affects a lot of systems. You would like to see metrics of your progress instantly.
What works already
I personally usually find myself in scenario #2, but I know colleguages often have the spontanuous motivation and perspective of scenario #3. And I believe in a small startup company with only a few systems being the sole sysadmin you might find yourself in scenario #1 (happy you!). With all three scenarios being realistic use cases I want them to work in polscan. Currently the main screen of polscan looks like this: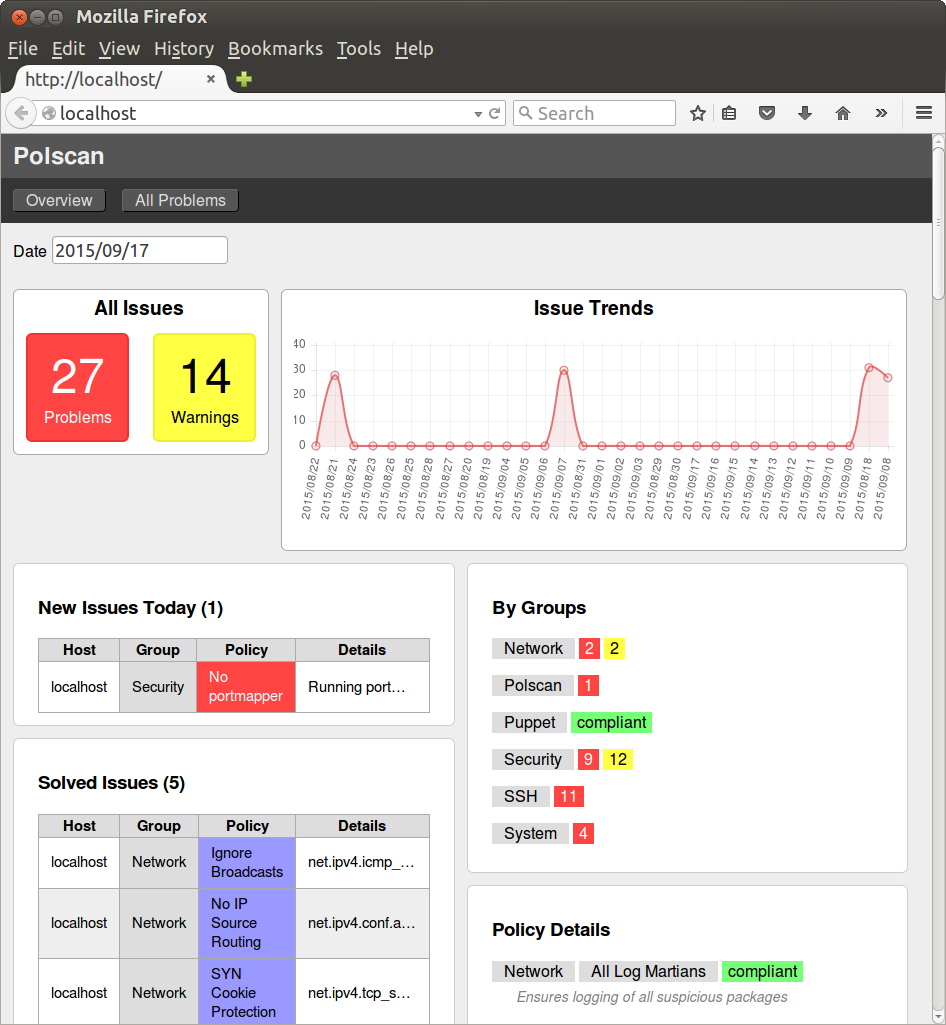 So how are the different scenarios supported already and where not?
- Scenario #1: "Everything under control"
- Overview with drill down links is implemented
- Well supported scenario
- Scenario #2: "I'm swamped!"
- Overview has 30 days trending graph for critical findings
- Policy/Group drill down result views also have the trending graph
- Progress is easy to track
- Overview has 'New' and 'Solved' tables giving delta statistics
- 'New' and 'Solved' result drill-down is still missing
- Scenario #3: "Let's fix something"
- The per-policy grouping in the overview allows tackling large blocks of findings.
- No support yet to group hosts (e.g. with same security updates) to work on those
- No instant feedback on achievements
What I'm working on
Next things to improve the scenarios:- Separate result table views (with filtering) for 'New' and 'Solved' results
- Drill-down in even more places
- Merging the scanner documentation in the GUI
- Also show warnings in trending graph
- Maybe show 'new' and 'solved' count in trending graph too
- Think about a concept to group by lists that are in the 'Details' field. This would be excessively useful for policies like 'Pending Updates'
- In general allow group changes in result tables (e.g. group by 'Details' field for a certain policy to get a host histogram
What is your use case? In which mode are you working and what do you need most?