When using
memcached or memcachedb everything is fine as long as it is running. But from an operating perspective memcached is a black box. There is no real logging you can only use the -v/-vv/-vvv switches when not running in daemon mode to see what your instance does. And it becomes even more complex if you run multiple or distributed memcache instances available on different hosts and ports. So the question is:
How to monitor your distributed memcache setup? There are not many tools out there, but some useful are. We'll have a look at the following tools. Note that some can monitor multiple memcached instances, while others can only monitor a single instance at a time.
| Name | Multi-Instances | Complexity/Features |
|---|
| telnet | no | Simple CLI via telnet |
| memcached-top | no | CLI |
| stats-proxy | yes | Simple Web GUI |
| memcache.php | yes | Simple Web GUI |
| PhpMemcacheAdmin | yes | Complex Web GUI |
| Memcache Manager | yes | Complex Web GUI |
1. Use telnet!
memcached already brings it own statistics which are accessible via telnet for manual interaction and are the basis for all other monitoring tools.
Read more about using the telnet interface.
2. Live Console Monitoring with memcached-top
You can use
memcache-top for live-monitoring a single memcached instance. It will give you the I/O throughput, the number of evictions, the current hit ratio and if run with "--commands" it will also provide the number of GET/SET operations per interval.
memcache-top v0.6       (default port: 11211, color: on, refresh: 3 seconds)

INSTANCE                USAGE   HIT %   CONN    TIME    EVICT/s GETS/s  SETS/s  READ/s  WRITE/s
10.50.11.5:11211        88.9%   69.7%   1661    0.9ms   0.3     47      9       13.9K   9.8K
10.50.11.5:11212        88.8%   69.9%   2121    0.7ms   1.3     168     10      17.6K   68.9K
10.50.11.5:11213        88.9%   69.4%   1527    0.7ms   1.7     48      16      14.4K   13.6K
[...]

AVERAGE:                84.7%   72.9%   1704    1.0ms   1.3     69      11      13.5K   30.3K

TOTAL:          19.9GB/ 23.4GB          20.0K   11.7ms  15.3    826     132     162.6K  363.6K
(ctrl-c to quit.)
(Example output)
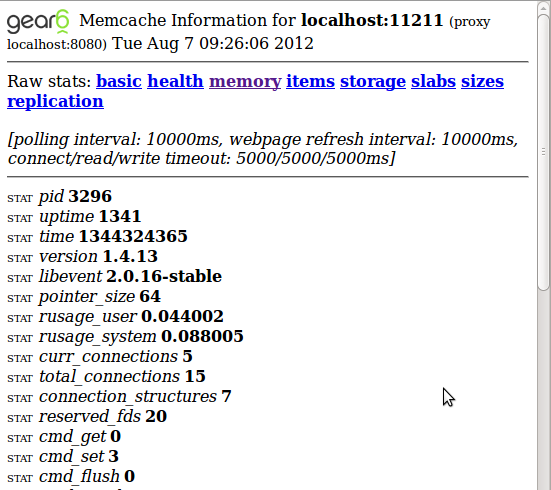
3. Live browser monitoring with statsproxy
Using the
statsproxy tool you get a browser-based statistics tool for multiple memcached instances. The basic idea of statsproxy is to provide the unmodified memcached statistics via HTTP. It also provide a synthetic health check for service monitoring tools like
Nagios. To compile statsproxy on Debian:
# Ensure you have bison
sudo apt-get install bison

# Download tarball
tar zxvf statsproxy-1.0.tgz
cd statsproxy-1.0
make
Now you can run the "statsproxy" binary, but it will inform you that it needs a configuration file. I suggest to redirect the output to a new file e.g. "statsproxy.conf" and remove the information text on top and bottom and then to modify the configuration section as needed.
./statsproxy > statsproxy.conf 2>&1
Ensure to add as many "proxy-mapping" sections as you have memcached instances. In each "proxy-mapping" section ensure that "backend" points to your memcached instance and "frontend" to a port on your webserver where you want to access the information for this backend. Once finished run:
./statsproxy -F statsproxy.conf
Below you find a screenshot of what stats-proxy looks like:
4. Live browser monitoring with memcache.php
Using
this PHP script you can quickly add memcached statistics to a webserver of your choice. Most useful is the global memory usage graph which helps to identify problematic instances in a distributed environment. Here is how it should look (screenshot from the project homepage):
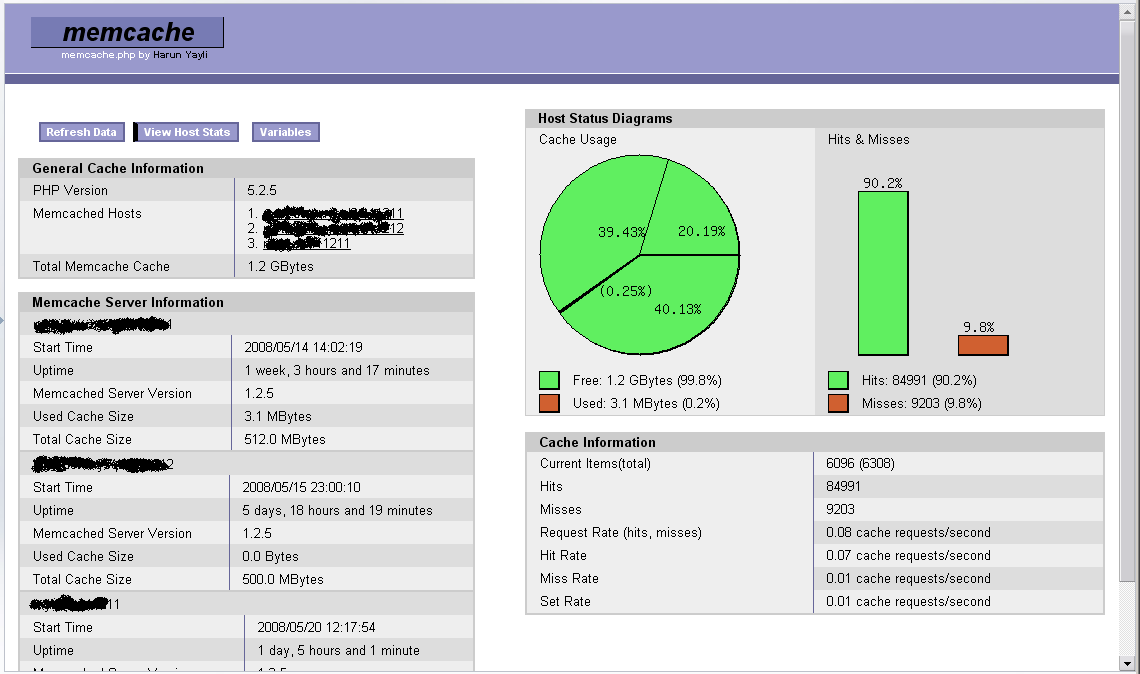
When using this script ensure access is protected and not to trigger the "flush_all" menu option by default. Also on large memcached instances refrain from dumping the keys as it might cause some load on your server.